
What Are the Best Solar Panels for Business in 2026?
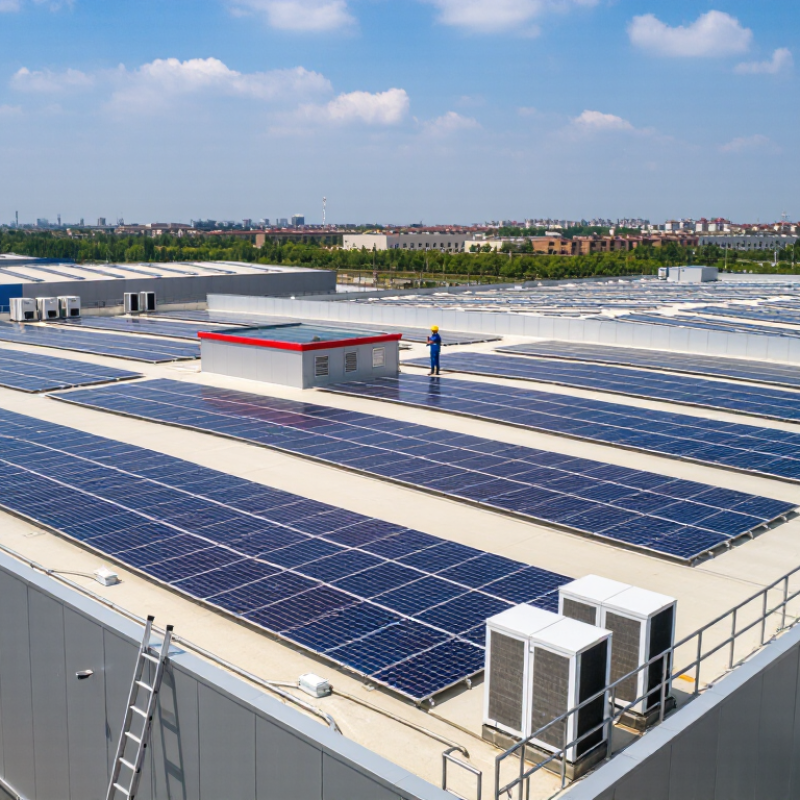
Choosing the best solar panels for business in 2026 is not simply a matter of selecting the highest-wattage module. A warehouse roof, a refrigerated shop, and a factory have different energy demands. Their roofs differ, too. The right system should match usable roof space, daytime electricity use, local weather, utility costs, and the company’s plans for its property. Small details matter.
Fatih Birol, executive director of the International Energy Agency, described solar’s growing role this way: “Solar is the new king of electricity markets around the world.” That momentum makes commercial solar worth evaluating, but it does not make every panel a good fit. There is no neat winner. Not for every roof. A module that performs well in a sunny, open location may not deliver the same value on a shaded roof with limited space.
This guide examines solar panels for business through practical criteria: power output, efficiency, temperature performance, product and performance warranties, and the installer’s proposed system design. It also considers how panel choice affects usable roof area and future maintenance. Compare complete proposals, not just price per panel. Ask for projected annual production and the assumptions behind it. Check that the design accounts for shading, roof condition, and the business’s actual load profile. Those estimates can be imperfect. Real weather, operating hours, and energy prices change. A careful comparison can still help business owners make a more informed decision—without treating a headline efficiency figure as the whole story.
Define Business Panel Criteria Using NREL’s ~0.5%/Year Degradation Benchmark
For a business, a panel’s nameplate wattage is only part of the buying decision. NREL researchers’ review of photovoltaic field studies reported a median degradation rate near 0.5% per year. Treat that figure as a planning benchmark, not a guarantee for every roof or climate. At that rate, a 500-watt panel would retain roughly 440 watts after 25 years, before accounting for site-specific conditions.
That matters. Ask bidders to state annual degradation assumptions and show projected year-25 output using the same method. Check whether performance guarantees distinguish gradual power loss from equipment failure. The IEA PVPS Task 13 reliability work also highlights how climate, installation, and operating conditions affect field performance. A hot warehouse roof, coastal air, or uneven shade can make a generic estimate less useful. Request independent test data, temperature coefficients, and documented warranty exclusions. Compare them alongside installation quality and expected maintenance.
A tidy spreadsheet can still miss practical problems, like blocked access for cleaning or a roof replacement halfway through the system’s life. I would not select a panel on degradation alone. Yet if two proposals look similar, a transparent loss assumption is easier to verify than a broad promise. NREL’s figure is a useful starting point, not the finish line.
What Are the Best Solar Panels for Business in 2026? — Define Business Panel Criteria Using NREL’s ~0.5%/Year Degradation Benchmark
Use the figures below as technology-level screening ranges, not as guaranteed specifications for any individual module. NREL’s roughly 0.5% per year degradation figure is a useful fleet-level benchmark; actual performance varies with module design, climate, installation, and operating conditions. Verify each shortlisted module’s current datasheet, warranty, and independent test results.
| Panel technology | Typical module efficiency | Indicative annual degradation | Typical power temperature coefficient | Business-site fit | Checks before procurement |
|---|---|---|---|---|---|
| Monocrystalline PERC | About 20%–22.5% | Often around 0.4%–0.6% per year; compare the warranted degradation schedule with the ~0.5%/year benchmark. | Commonly about −0.34% to −0.40% per °C | A mature option for rooftops and ground-mounted commercial systems where broad availability and established installation practices matter. | Check remaining product availability, warranty terms, temperature coefficient, and whether the offered module format suits the roof layout. |
| N-type TOPCon | About 22%–24% | Often specified around 0.4%–0.5% per year; confirm the exact first-year and subsequent-year rates in the warranty. | Commonly about −0.29% to −0.35% per °C | A strong candidate when higher output per roof area and lower heat-related power loss are important. | Compare independently verified efficiency, low-light behavior, degradation warranty, module dimensions, and supplier-backed warranty support. |
| Heterojunction (HJT) | About 22%–24.5% | Some product specifications are below 0.5% per year; use the specific warranted rate rather than assuming a technology-wide value. | Commonly about −0.24% to −0.30% per °C | May suit space-constrained or hot-climate projects where high efficiency and a favorable temperature coefficient can add value. | Check delivered cost per watt, verified performance data, installation compatibility, and warranty exclusions. |
| Cadmium telluride (CdTe) thin film | About 18%–20% | Product-specific; compare the warranted rate with the ~0.5%/year benchmark and review any first-year allowance. | Often around −0.25% to −0.32% per °C | Can be considered for large sites where land or roof area is less constrained and performance in hot conditions is relevant. | Assess area required, structural and electrical design, project logistics, recycling arrangements, and product-specific certifications. |
| Business-panel selection criteria | Prioritize usable output per available area rather than efficiency alone. | Screen around 0.5%/year; favor a lower documented rate when lifecycle economics support it. | Compare coefficients using the same test conditions and units. | Match the module to roof loading, shading, site climate, inverter design, fire requirements, and the business’s load profile. | Request current datasheets, warranty documents, IEC certification evidence, independent test data, and project-specific energy-yield estimates. |
Related Posts
-
What Is the Best Solar Panel for Business?
-
Top Benefits of Getting Solar Panels for Your Home Today?
-

2026 Top Solar Panels Trends for Global Buyers?
-
What is the Process of Getting Solar Panels for Your Home?
-

Top 5 Benefits of Getting Solar Panels for Your Home?
-

2026 How to Choose the Best Solar Panel Contractors for Your Home?